Silicon characterization is not a PVT sweep: the physics behind process corners, mismatch, droop and temperature
Putting silicon characterization on your resume won’t help you crack a top semiconductor interview if your daily routine is just: drop the chip under a ThermoStream → sweep PVT → dump the data into Excel.
Companies like NVIDIA, Qualcomm, AMD and Intel aren’t looking for someone who can only place different silicon skews under a ThermoStream and log numbers. They want an engineer who understands why the numbers move:
- Process corners: what TT, FF, SS, FS and SF actually mean at the NMOS and PMOS transistor level.
- PVT interactions: how threshold voltage, carrier mobility and switching speed shift across voltage and temperature for each corner.
- Leakage behaviour: why an FF part that looks great for timing can turn into a thermal-runaway problem at high temperature.
One chip is never identical to another, even when both come from the same wafer. This article walks through why, in four parts, with the points interviewers like to probe marked as Interview tip. Read it start to finish, or jump straight to a part:
In this article
| Part | Question it answers |
|---|---|
| 1. Global variation | Why does die A behave differently from die B? |
| 2. Local mismatch | Why don’t two identical transistors, a micrometre apart, match? Why does that set SRAM Vmin? |
| 3. Supply droop | Why does SS fail setup timing first when the voltage droops? |
| 4. Temperature | Why can an SS part be slower when cold at low voltage? |
| Bonus: Leakage | Why FF draws more current and can run away thermally |
| Summary | Which corner to check for which failure |
Part 1: Global (die-to-die) variation and the five process corners
Every die from a fab is built from the same mask set, yet no two dies are electrically identical. The usual interview answer is “manufacturing tolerance” or “position on the wafer”. That’s true but incomplete: what is physically different inside the silicon?
Global variation comes from how a whole wafer, or a whole lot, is processed:
- Radial gradients: properties change from the centre of the wafer to the edge.
- Process drift: furnace temperature and ion-implant dose drift from run to run.
These shift the doping concentration, gate length (Leff), gate-oxide thickness (tox) and therefore threshold voltage (Vth).
The key property: global variation moves all transistors on one die in the same direction. A die that came out “fast” is fast everywhere on that die.
Foundries measure thousands of test transistors and plot NMOS against PMOS saturation current (ID,sat). The spread forms a cloud, and the ±3σ box around it defines the corners:

| Corner | NMOS / PMOS | Physical cause | What it means on the bench |
|---|---|---|---|
| TT (typical-typical) | typical / typical | Centre of the distribution | The reference everything is compared against |
| FF (fast-fast) | fast / fast | Low Vth, short Leff, thin tox | Highest drive current, fastest timing, but leakage rises exponentially |
| SS (slow-slow) | slow / slow | High Vth, long Leff, thick tox | Lowest overdrive and current: the classic setup-critical corner |
| FS (fast-slow) | fast / slow | Skewed | Pull-down stronger than pull-up: rise and fall delays unbalanced |
| SF (slow-fast) | slow / fast | Skewed | Pull-up stronger than pull-down: the opposite imbalance |
Interview tip: the skewed corners (FS, SF) create a tug-of-war between the pull-up (PMOS) and pull-down (NMOS) networks. They matter most for circuits that depend on that balance:
- SRAM read and write margins;
- level shifters;
- duty-cycle-sensitive clock paths;
- I/O drivers.
Don’t treat them as “in-between” corners.
Part 2: Local (within-die) mismatch and the SRAM Vmin cliff
Global corners explain why die A differs from die B. Now zoom in: two transistors, drawn identically and sitting a micrometre apart on the same die. Same mask, same implant, same anneal. They should be twins, but in real silicon they never are.
Counting atoms: random dopant fluctuation (RDF)
Ion implantation is a random, statistical process. In an older planar transistor the channel may hold only tens to a few hundred dopant atoms. Transistor A might receive 20 while transistor B, right beside it, receives 23. That difference is random dopant fluctuation (RDF), and because Vth depends on the dopant charge, the two devices get different thresholds.
To get a feel for the numbers at a modern node:
- Area per transistor: TSMC N7 (used for Apple’s A12) has roughly 91 million transistors per mm². That is about 11,000 nm² of silicon per transistor.
- Silicon atoms in that area: a 20 nm-thick slice of that area holds about 11 million silicon atoms (silicon has about 50 atoms per nm³).
- Atoms in the channel: the part that actually decides Vth is far smaller. In a fin about 7 nm wide under a 20 nm gate, that channel region holds only a few hundred thousand silicon atoms. At the light doping FinFETs use, that is fewer than ten dopant atoms.
Interview tip: FinFETs deliberately use lightly doped channels to reduce RDF. At these nodes, mismatch is driven increasingly by other random effects:
- Line-edge roughness (LER): the gate and fin edges are never perfectly straight.
- Fin width and height variation.
- Metal-gate work-function variation: the gate metal is made of tiny grains with slightly different work functions.
The randomness never goes away; its source moves.
Pelgrom’s law
Mismatch between two identical devices is described by Pelgrom’s law:
σ(ΔVth) = A_Vt / √(W · L)

A_Vt : matching coefficient of the process (typically a few mV·µm)
W, L : transistor width and length
The smaller the transistor, the bigger the random Vth spread. With AVt ≈ 2 mV·µm:
| Device size (W × L) | σ(ΔVth) |
|---|---|
| 1 µm × 1 µm (analog-style device) | ≈ 2 mV |
| 0.1 µm × 0.03 µm | ≈ 37 mV |
| 0.05 µm × 0.02 µm (SRAM-like) | ≈ 63 mV |
That’s tens of millivolts of random Vth difference between side-by-side, identically drawn transistors.
The bench reality: the SRAM Vmin cliff
SRAM uses the smallest transistors on the die, and millions of them. Inside a 6T cell, two cross-coupled inverters hold the bit:
- During a read, the access transistor fights the pull-down (read stability).
- During a write, it fights the pull-up (writability).
- A few tens of millivolts of mismatch can tip that fight the wrong way.
Sweep VDD down and the array doesn’t degrade gradually. Everything passes until the single weakest cell out of millions fails. That voltage is your Vmin.
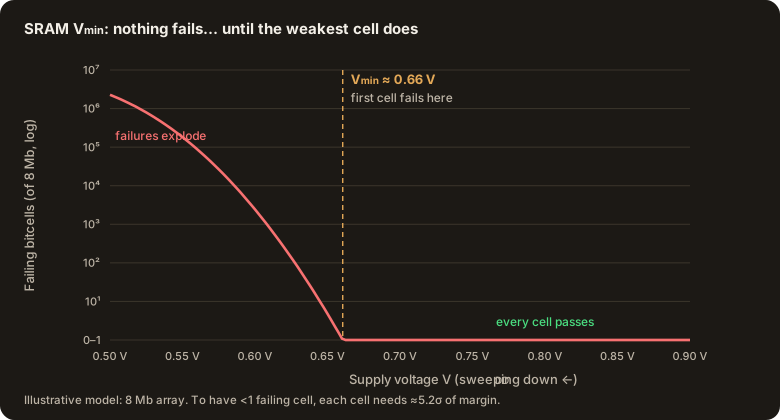
Interview tip: with 8 million cells, you need roughly 5.2σ of margin per cell to expect fewer than one failing cell. With 100 million cells you need about 5.6σ. That’s why SRAM is designed and characterised for the tail of the distribution, not the average.
Global corners set the baseline, but local random mismatch decides the tail, and the tail decides Vmin.
Part 3: Why SS fails setup timing first when the voltage droops (and FF survives)
The voltage your bench supply sets (say 1.00 V) is rarely what the transistors see. Two effects take some of it away:
- Static IR drop: current × resistance of the power grid.
- Dynamic droop: sudden current steps when activity changes.
Inside a busy core, the transistors might see 0.93 V.
Why SS is the worst-case corner for setup
Assume Vth = 0.40 V for SS and 0.30 V for FF:
- Less overdrive: SS’s high Vth leaves less of the supply as overdrive once the transistor turns on: 0.93 − 0.40 = 0.53 V, compared with 0.93 − 0.30 = 0.63 V for FF. (SS draws less current, so its droop is in fact slightly smaller, but its overdrive is still the lowest.)
- Weaker gate control: its thicker tox puts the gate further from the channel, so fewer carriers are pulled in.
- Longer path for carriers: its longer Leff makes them travel further, which reduces current.
Less drive current means each gate switches more slowly, and slow edges make the next gate slow too.
Example: if a gate takes 50 ps at TT and 55 ps at SS, a 17-gate path takes 850 ps at TT but 935 ps at SS. The data arrives 85 ps later than expected.
Why a droop hurts SS the most
Gate delay roughly follows the alpha-power law: delay ∝ VDD / (VDD − Vth)α, with α ≈ 1.3 for short-channel devices. The smaller the overdrive, the more a given droop slows the gate:
| Corner (Vth) | Delay increase for a 10 % supply drop (1.00 V → 0.90 V) |
|---|---|
| FF (0.30 V) | +10.0 % |
| TT (0.35 V) | +11.8 % |
| SS (0.40 V) | +14.1 % |
So SS starts with the least setup slack and also loses the most when the supply droops.
Interview tip: this is why validation always checks SS at minimum supply voltage combined with worst-case droop: it’s the combination most likely to fail setup. (FF has the opposite problem: it is the corner to check for hold violations and leakage.)
Part 4: Is hot silicon always slower silicon?
The textbook says “hot silicon is slower silicon”. So why does an SS part at 0.60 V run slower at −40 °C than at 125 °C?
Drive current depends on two temperature effects that pull in opposite directions:
- Carrier mobility: as temperature rises, the silicon lattice vibrates harder and carriers scatter more, so mobility drops. Hot makes carriers slower.
- Threshold voltage: as temperature rises, Vth drops (roughly 1 mV per °C). A lower Vth means more gate overdrive (VDD − Vth). Hot makes the transistor turn on harder.
Which effect wins depends on how much overdrive you have:
- High-voltage regime (mobility wins): at nominal VDD (e.g. 1.00 V) there is plenty of overdrive. The extra overdrive from the lower Vth is small compared with the loss of mobility, so hot is slower. In the model below, 125 °C is about 20 % slower than 25 °C.
- Low-voltage regime (temperature inversion): at 0.60 V the overdrive is razor-thin. Cooling to −40 °C improves mobility, but Vth climbs and chokes off what little overdrive is left. Now cold is slower: at −40 °C the SS part runs about 20 % slower than at 125 °C.
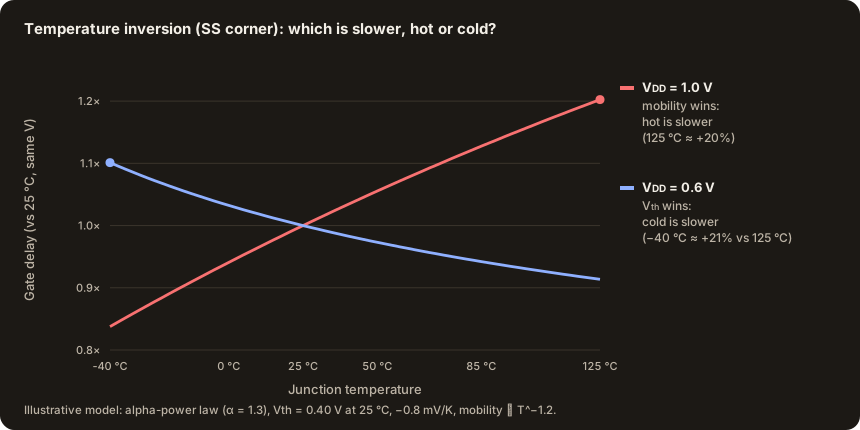
Between those two regimes there is a supply voltage where the two effects cancel. It’s often called the zero-temperature-coefficient (ZTC) point, around 0.66 V in this model. Above it, hot is the slow corner. Below it, cold is.
The bench reality:
- A chip passes timing at 125 °C and nominal voltage.
- A car starts on a freezing winter morning at −40 °C, and the battery voltage droops.
- The silicon drops into the temperature-inversion region, the slow logic fails to boot, and the ECU crashes.
Interview tip: for low-voltage designs, the worst-case setup corner can be SS / low VDD / cold, not SS / hot. Characterization plans for low-power modes must cover both temperature extremes at minimum voltage.
Bonus: why FF draws more current, and how it can run away thermally
Run an FF die and an SS die with the same code, at the same frequency and voltage, and the FF die draws noticeably more current. Most of the difference is leakage: subthreshold leakage grows exponentially as Vth falls and as temperature rises.
I_sub ∝ exp( −Vth / (n · kT/q) ) (roughly, at Vgs = 0)With the same illustrative numbers (n ≈ 1.4):
- FF vs SS: an FF device (Vth 0.30 V) leaks about 16× more than an SS device (0.40 V) at 25 °C.
- Hot vs room temperature: leakage grows about 40× from 25 °C to 125 °C.
That creates a positive feedback loop: more leakage → more power → higher temperature → even more leakage. A fast part at high temperature with poor cooling can thermally run away. So FF / hot / maximum VDD is the corner for power, thermal and reliability limits, just as SS / low VDD is the corner for timing.
Putting it together: what a characterization engineer actually checks
| Concern | Worst-case combination | Why |
|---|---|---|
| Setup timing (nominal VDD) | SS · Vmin + droop · hot | Least overdrive and lowest mobility |
| Setup timing (low-power modes) | SS · low VDD · cold | Temperature inversion |
| Hold timing | FF · high VDD · cold | Fastest data paths |
| SRAM Vmin | Skewed / SS corners, low VDD, both temperatures | The tail of local mismatch |
| Leakage, power, thermal | FF · high VDD · hot | Exponential leakage and thermal runaway |
Characterization isn’t about collecting data. It’s where validation engineers explain the data, and catch the real silicon bugs. Before your next interview, don’t just run the automation script: know the silicon.
The numbers in Parts 3 and 4 and in the bonus section come from simple textbook models (alpha-power law, mobility ∝ T⁻¹·², dVth/dT ≈ −0.8 mV/K) to show the trends. Real values come from your process’s device models, standard-cell libraries and bench data.
This article as a LinkedIn series
This article combines my LinkedIn series:
- Why silicon characterization is more than a PVT sweep
- Part 1: The physics of process skews
- Part 2: Why adjacent transistors on the same die don’t match
- Part 3: Why SS fails setup timing first when voltage droops
- Part 4: Is hot silicon always slower silicon?
References
- M. J. M. Pelgrom, A. C. J. Duinmaijer, A. P. G. Welbers, Matching properties of MOS transistors, IEEE Journal of Solid-State Circuits, 1989.
- T. Sakurai, A. R. Newton, Alpha-power law MOSFET model and its applications to CMOS inverter delay, IEEE Journal of Solid-State Circuits, 1990.
- Wikipedia, 7 nm process: TSMC N7 density (≈91–97 MTr/mm²), 20 nm gate length.
Join the discussion
Found this useful?
Like, comment & share on LinkedIn. Questions and corrections are welcome in the comments.
Open the LinkedIn post